Wednesday, 12 June 2013
Simple Pie Chart Implementation In Turbo C
This is a very simple implementation of pie chart in Turbo C. The source code is quite easy to read through so must not be the big problem understanding the code.
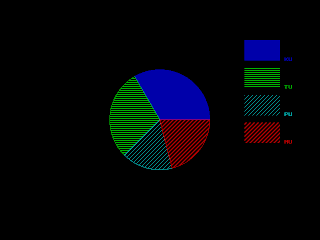
This implementation makes use of pieslice() function which draws and fills the pie slice with centre x, y and radius r. The function also requires the start angle and end angle.
Below is the screenshot for sample run:

This implementation makes use of pieslice() function which draws and fills the pie slice with centre x, y and radius r. The function also requires the start angle and end angle.
#include <stdio.h>
#include <conio.h>
#include <graphics.h>
#include <math.h>

#define MAX 20
#define X_CENTRE getmaxx()/2
#define Y_CENTRE getmaxy()/2
#define RADIUS 100

struct pie_data
{
 char desc[100];
 int freq;
 int color;
 int style;
 float angle;
};

int main()
{
 struct pie_data data[MAX];
 int gd = DETECT, gm;
 int i, j, k, n, total_freq = 0, start_angle = 0, end_angle = 0, xmax, ystart = 80, yend;
 printf("Enter the number of items: ");
 scanf("%d", &n);

 for (i = 0, j = 1, k = 1; i < n; i++)
 {
  printf("Enter the item title: ");
  scanf("%s", data[i].desc);
  printf("Enter the item frequency: ");
  scanf("%d", &data[i].freq);
  total_freq += data[i].freq;
  data[i].color = j;
  data[i].style = k;
  if (j++ >= 13) j = 1;
  if (k++ >= 11) k = 1;
 }

 for (i = 0; i < n; i++)
 {
  float angle;
  data[i].angle = 360 * (data[i].freq /(float) total_freq);
 }

 initgraph(&gd, &gm, "C:\\TurboC3\\BGI");
 xmax = getmaxx() - 150;
 setaspectratio(10000, 10000);
 for (i = 0; i < n; i++)
 {
  end_angle = start_angle + data[i].angle;
  setcolor(data[i].color);
  setfillstyle(data[i].style, data[i].color);
  pieslice(X_CENTRE, Y_CENTRE, (int)start_angle, (int)end_angle, RADIUS);
  start_angle = end_angle;
  yend = ystart + 40;
  bar(xmax, ystart, xmax + 70, yend);
  ystart = yend + 15;
  outtextxy(xmax + 80, ystart - 20, data[i].desc);
 }
 getch();
 closegraph();
 return 0;
}
Below is the screenshot for sample run:

Labels:
c,
C/C++,
computer graphics,
programming
Bookmark this post:blogger tutorials
Social Bookmarking Blogger Widget |
Simple Pie Chart Implementation In Turbo C
2013-06-12T10:09:00+05:45
Cool Samar
c|C/C++|computer graphics|programming|
Subscribe to:
Post Comments (Atom)